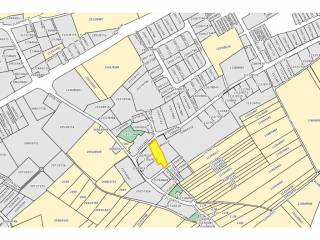
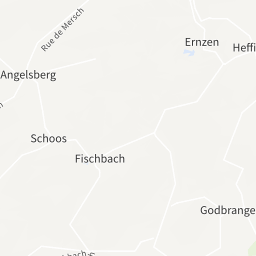
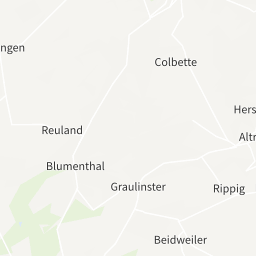
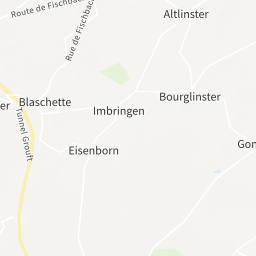
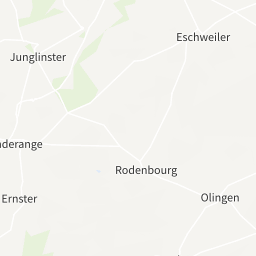
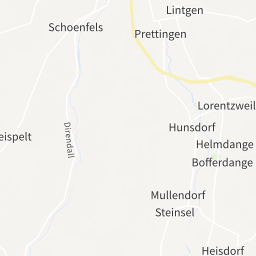
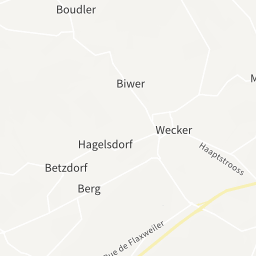
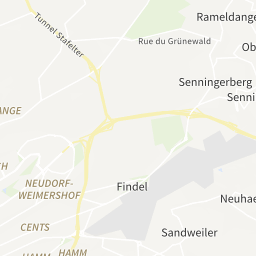
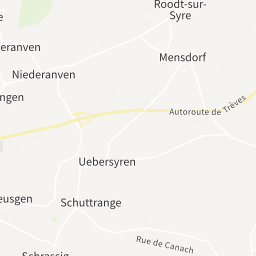
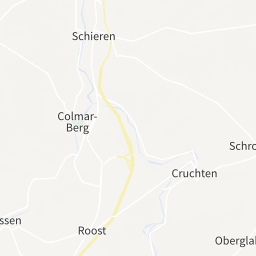
Housing price in the Junglinster Localité area, Junglinster
The map shows the average prices of the residential properties in the area Junglinster Localité in Junglinster. The reference period is January 2025.
sale
8,436 €/m²
-
rent
21.92 €/m²
-
Or rely on the experience of a real estate agency
Search agencyProperty prices trend in the zone Junglinster Localité
The following charts show price trends over time for all types of residential property in the Junglinster Localité area, both for sale and for rent.
In January 2025 the average price asked for residential properties for sale was € 8,436 per square meter, with a decrease of 10.27% compared to January 2024 (9,402 €/m²). Over the past 2 years, the average price in the Junglinster Localité area reached its peak in the month of October 2023, with a value of € 9,414 per square meter. The month with the lowest asking price was November 2024: for a property for sale, the average price asked was € 8,414 per square meter.
In January 2025 the average price asked for residential rental properties was € 21.92 per month per square meter, with a decrease of 8.13% compared to January 2024 (€ 23.86 monthly per square meter). Over the past 2 years, the average price in the Junglinster Localité area reached its peak in the month of January 2024, with a value of € 23.86 per square meter. The month with the lowest asking price was March 2023: for a rental property, the average price asked was € 18.80 per month per square meter.