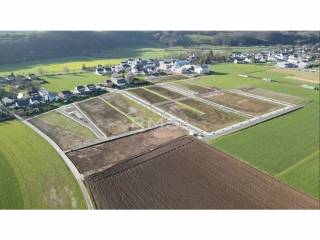
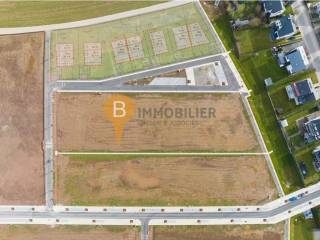
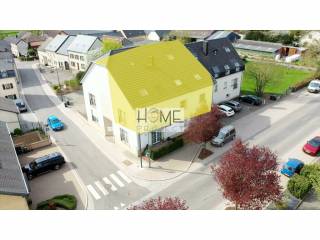
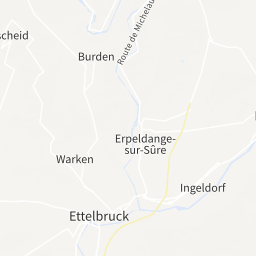
Housing price in the Erpeldange-sur-Sûre Localité area, Erpeldange-sur-Sûre
The map shows the average prices of the residential properties in the area Erpeldange-sur-Sûre Localité in Erpeldange-sur-Sûre. The reference period is January 2025.
sale
8,077 €/m²
-
rent
23.66 €/m²
-
Or rely on the experience of a real estate agency
Search agencyProperty prices trend in the zone Erpeldange-sur-Sûre Localité
The following charts show price trends over time for all types of residential property in the Erpeldange-sur-Sûre Localité area, both for sale and for rent.
In January 2025 the average price asked for residential properties for sale was € 8,077 per square meter, with an increase of 24.65% compared to January 2024 (6,480 €/m²). Over the past 2 years, the average price in the Erpeldange-sur-Sûre Localité area reached its peak in the month of July 2024, with a value of € 9,038 per square meter. The month with the lowest asking price was February 2024: for a property for sale, the average price asked was € 6,262 per square meter.
In January 2025 the average price asked for residential rental properties was € 23.66 per month per square meter, with an increase of 56.17% compared to January 2024 (€ 15.15 monthly per square meter). Over the past 2 years, the average price in the Erpeldange-sur-Sûre Localité area reached its peak in the month of January 2025, with a value of € 23.66 per square meter. The month with the lowest asking price was April 2023: for a rental property, the average price asked was € 14.36 per month per square meter.